Eliminate reactive support & broken processes. Our work-flow unifies support from monitoring of services, to alerting, to directly creating auto-support cases, assignment to Command|POD support tier 3 engineers and unifying everything into ONE cloud app.
Build a fully integrated custom alert policy for your entire tech stack with granular workflows based on time of day, user, location, service, and more.
One Cloud Application
If we monitor it, we automatically start supporting it.
- Custom Alert Groups - Email Alerting - SMS - Variable Triggers - Customer Control - Real-Time Routing Changes
3
Auto-Support Cases
- Problem Events Trigger Auto-Support Cases - Example: Down Circuit - Support Cases Are Auto-Created and Auto-Assigned to Your Dedicated Command|POD
4
Command|POD Support
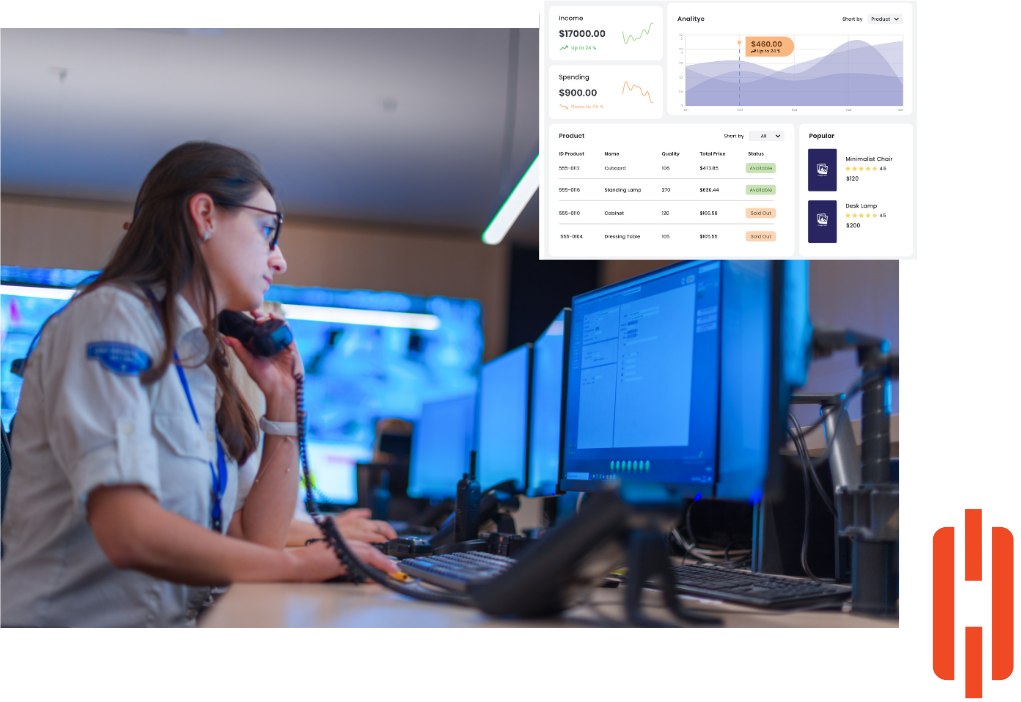
- Each Customer is Assigned to a Dedicated Tier 3 Engineering POD - 1:1 Case Ownership by Tier3 Engineers - Cases Assigned to Engineer Based on Skills, Availability & Direct Experience With Your Network - Over-Communication & Expert Help - Complete Transparency and Visibility
Powerful Visual
Mapping Tools
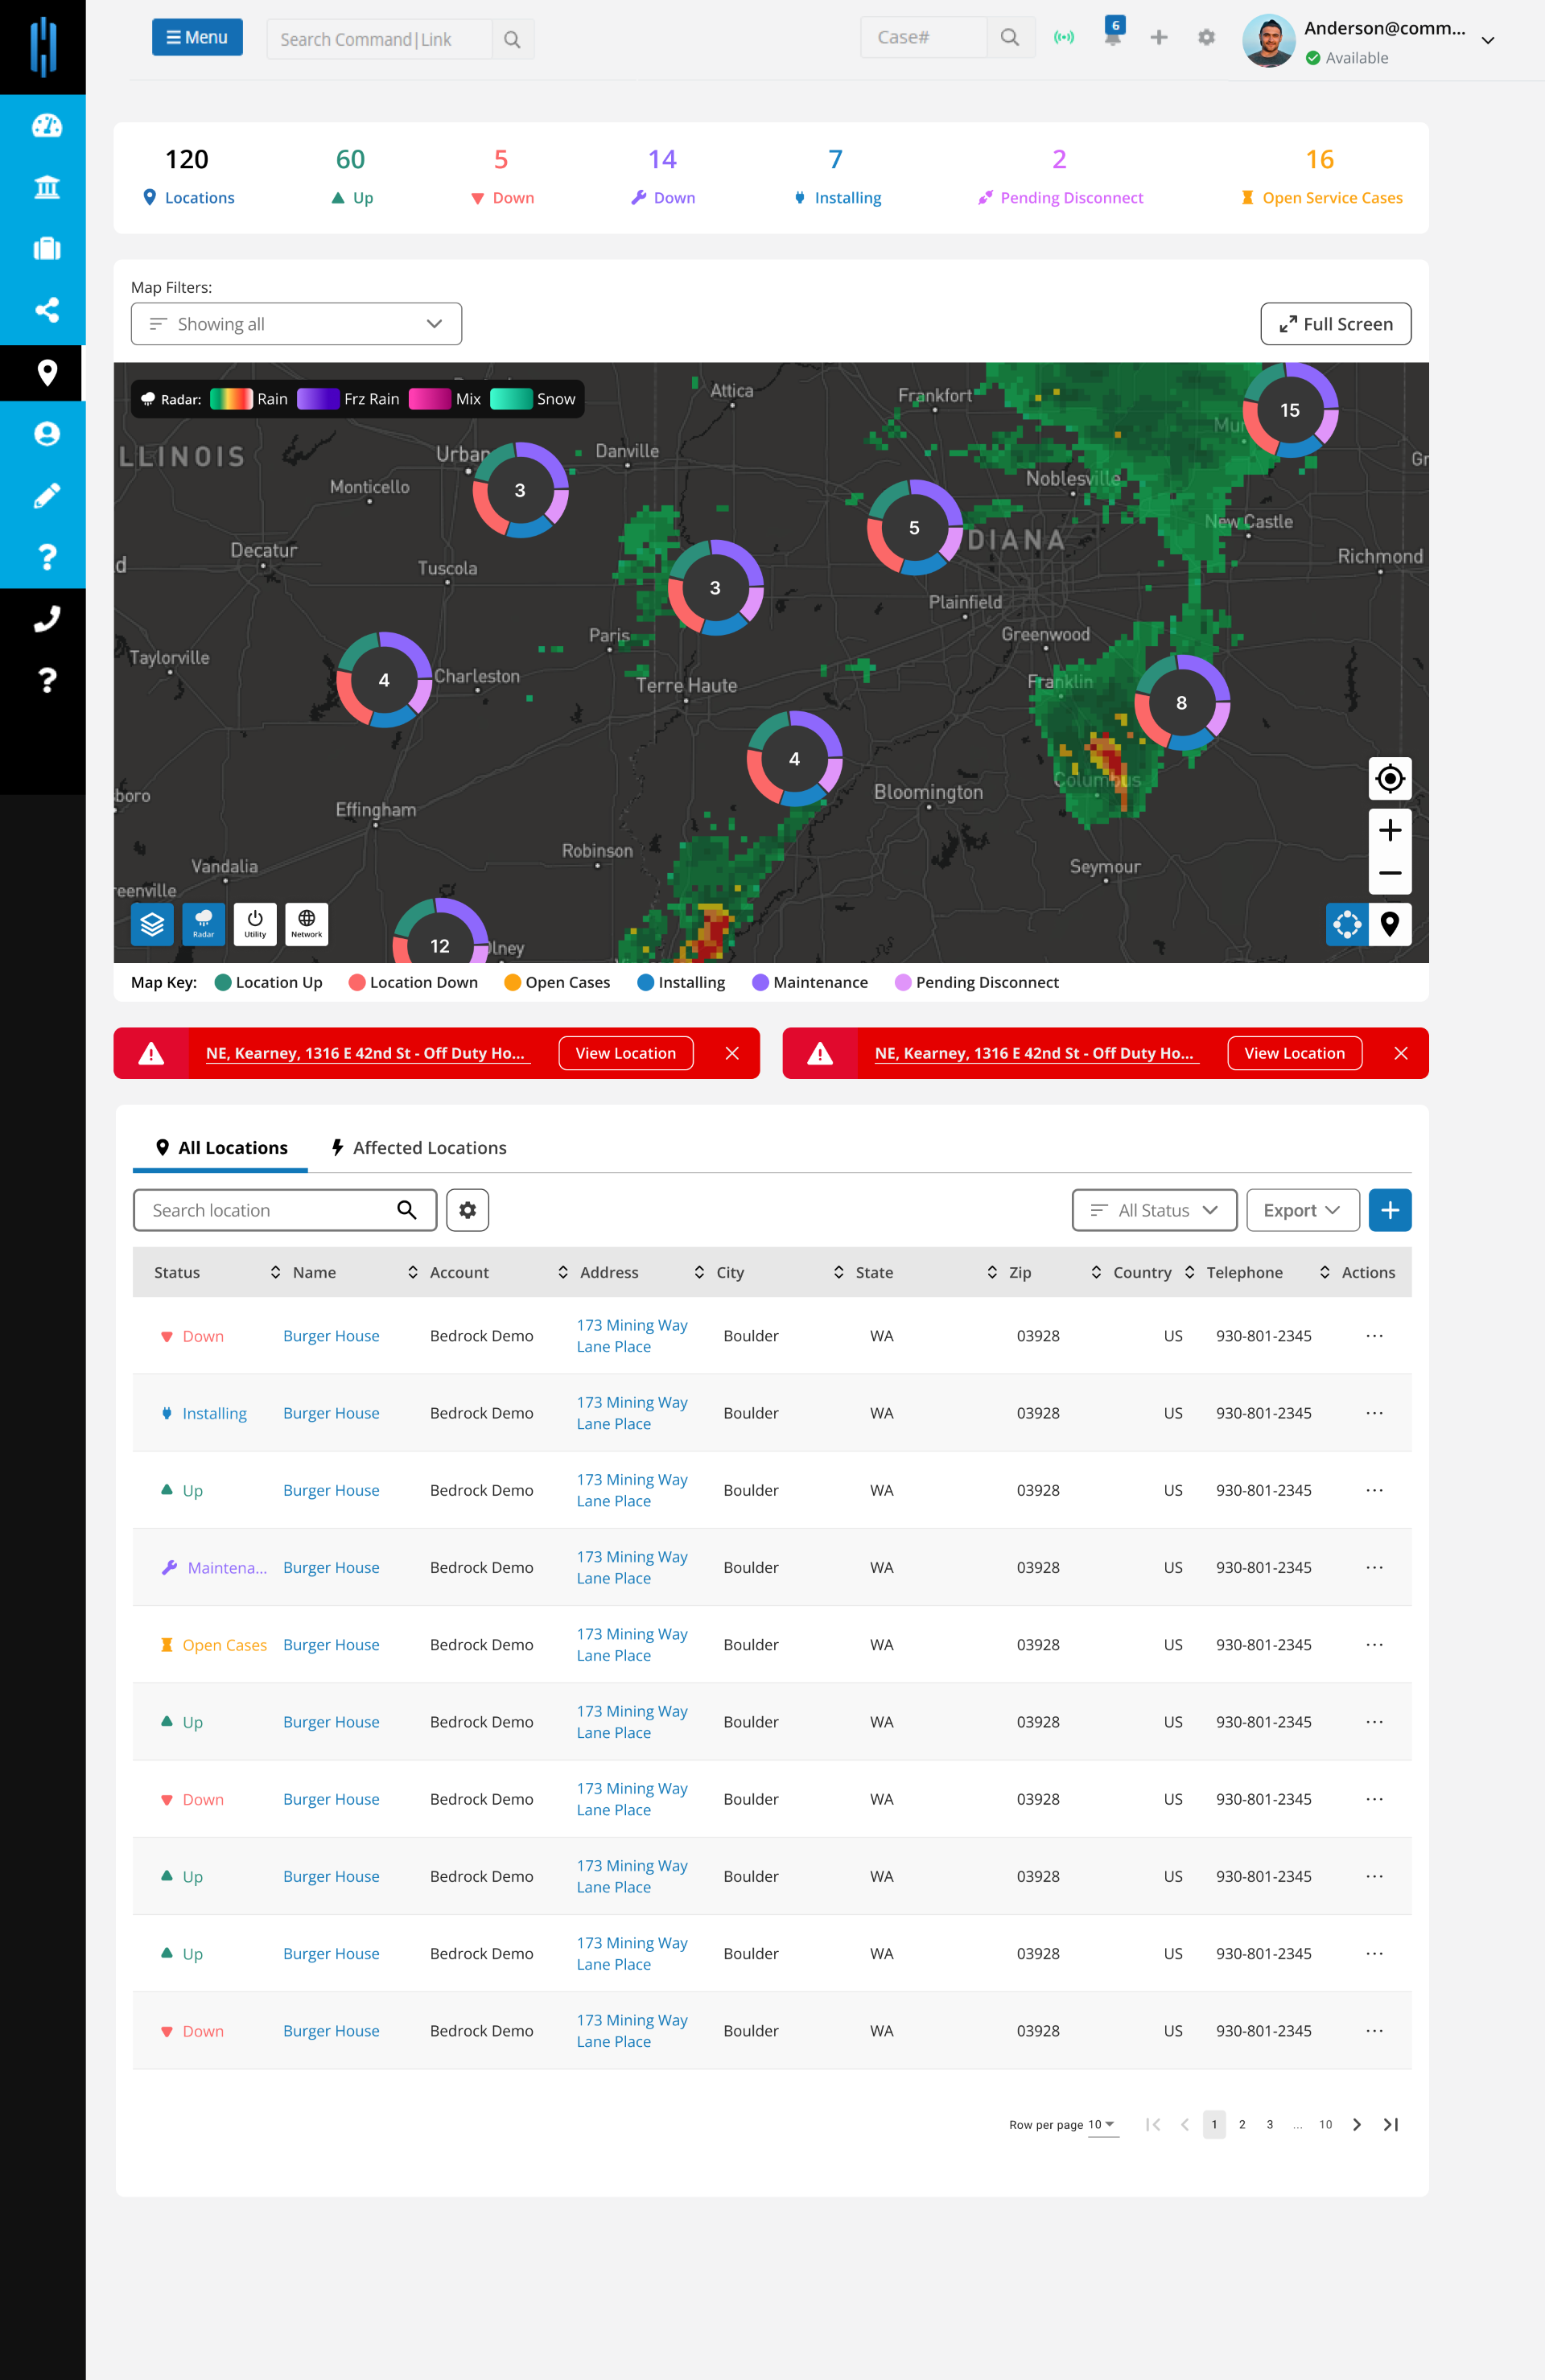
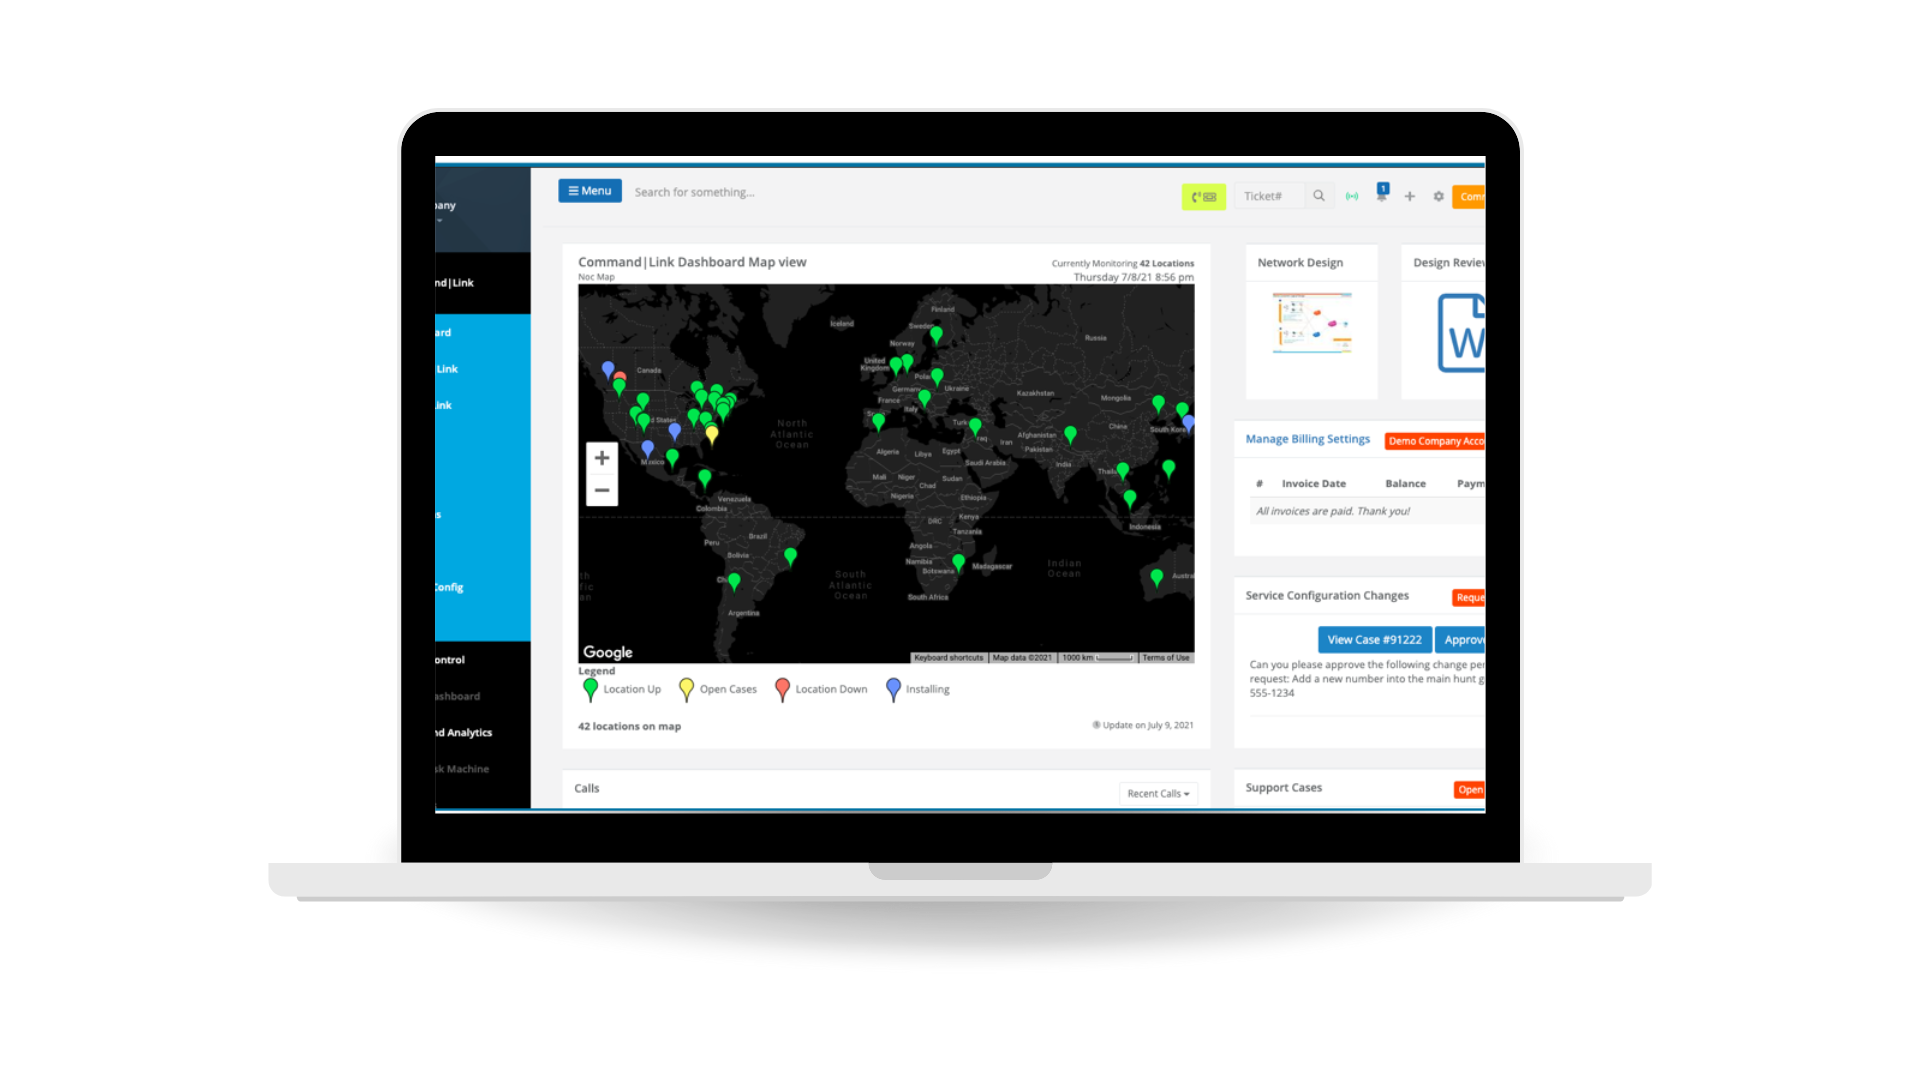
Instantly visualize your entire technology stack across the globe within a single pane of glass.
Command|WATCH Monitoring
A superior integrated monitoring solution within our CommandLink platform.
Designed to offer a holistic IT and telecom experience, this feature ensures real-time oversight of CommandLink services and your additional IT assets.
Platform Integrated Service Monitoring (Included with any IT/Telecom service from CommandLink):
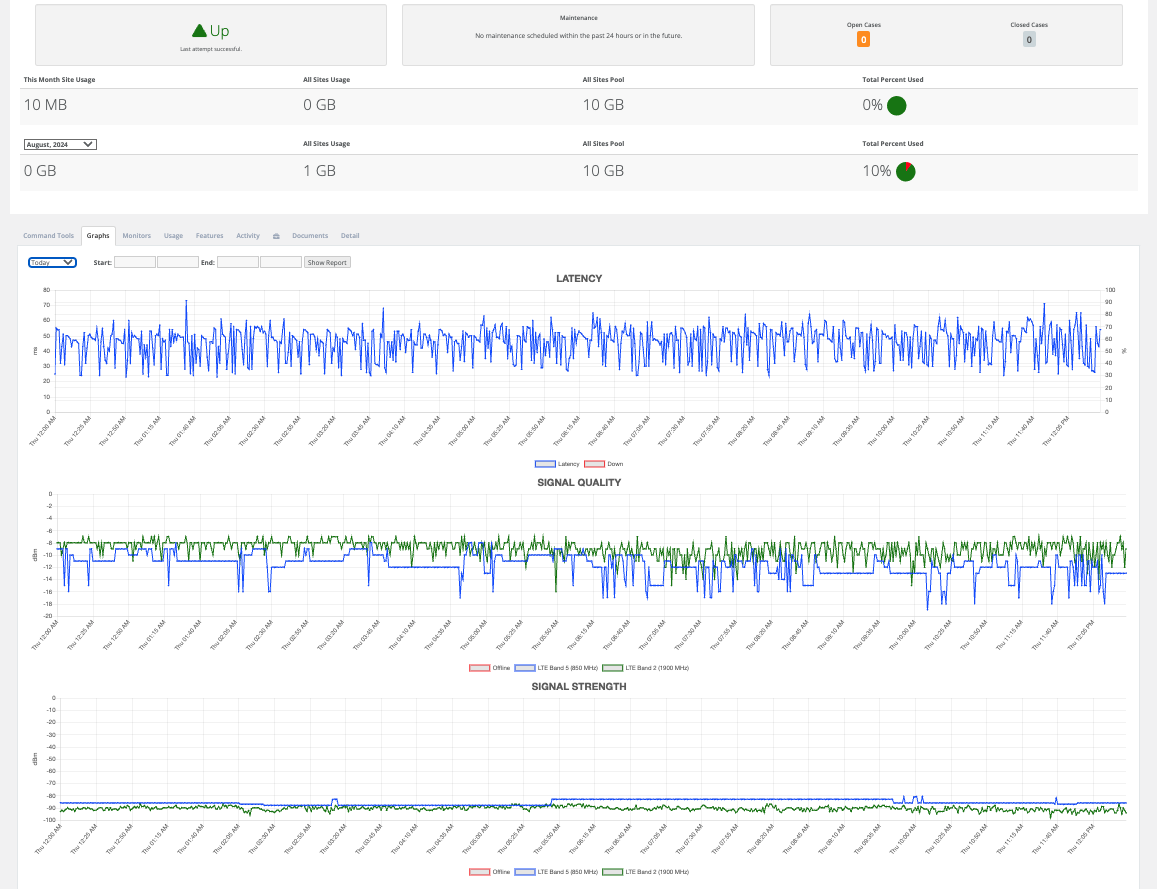
- Uptime - Latency - Packet Loss - Bandwidth Utilization
Command|Alert offers a superior integrated monitoring solution within our CommandLink platform. Designed to provide a holistic IT and Telecom experience, this feature ensures real-time oversight of CommandLink services and any additional IT assets.
Multi-Channel Notifications
Choose from email, SMS, or voice as the preferred contact method
Dynamic Prioritization
Classify alerts as low, medium, or high priority based on the severity and impact of the incident
Flexible Scheduling
Customize alert timings based on specific hours, days, or special exclusions
Alert Groups
Group multiple users together, allowing for tiered or simultaneous notifications
Custom Escalation Policy
Ensure incidents are acknowledged within set times; otherwise, they're escalated to higher authorities, guaranteeing accountability
Configurable Reminders
Set reminders at specific intervals, ensuring continued alertness until the issue is resolved
Full
Potential
Tap into the world's most sophisticated technology support model by integrating technology support and monitoring when and where you need it.
Unlimited
Possibilities
You decide on the process and we will follow your lead. Whether we address the problem directly or notify your team, it's up to you.
Superior
Outcomes
Enable custom workflow integrations with your TEM, Ticketing, CRM, ERP, Email, Phone, Text, or anything you can think of with the CommandLink API.
Dynamic Streaming Dashboards + Real-time Queues
An intuitive, adaptable dashboard designed to provide real-time insights into both service support and operational processes.
This tool streamlines ticket or case management for outages, configuration changes, and general support and emphasizes tracking for new installations, activations, and dispatches.
Tiles System
Each tile acts as a specialized monitor or queue, continuously observing specific facets of your operations. Track case assignments by individual team members, monitor activations as they go live, or keep an eye on dispatch schedules and completions. Each tile is customized to present data pertinent to your needs.
Customized Dashboards
Users can assemble a personalized collection of tiles to form a comprehensive dashboard. Have a dashboard focused on software testing, another for installations and activations, and a third dedicated to tracking dispatches. The flexibility allows for a tailored experience fitting your unique operational structure.
Real-Time Streaming
As your system evolves — new cases, activations, dispatches, comments, updates, or completions — your dashboard instantly reflects these changes. Stay informed in real-time, ensuring optimal response times and efficiency.
Interactive Interface
The user-friendly interface ensures an engaging experience. Assign, reassign, take action, and delve deeper into individual cases or dispatch details from your dashboard.
Optimized Performance
Oversee everything from routine activations to critical dispatches without any lag. Smooth scrolling, efficient data loading, and intuitive design mean you spend less time waiting and more time making informed decisions.
Single source platform to design, deploy and manage internet access, SD-WAN, SASE, security, cloud phone systems, & collaboration services in one unified SaaS platform.